Lorentz Yeung
Worked with Microsoft as Data Analyst / AI Certificate (Harvard University) / MSc in Digital Marketing / GC in Art History / Bachelor in Economics /
Back To Front PageStorage Optimisation
December 2023

Solving storage problems with Machine Learning Modelling. Image by OpenAI.
C-Suite Challenges:
- Want a data driven way to reduce storage costs
- Wnat a data-led way to balance overage and underage
- Want to mitigate profit erosion due to volatile inventory expenses.
I Recommended 3 Solutions:
- Implementing data-driven strategies to reduce costs by Catalogue Reduction
- Utilizing analytics to max potential profit by Strategic Overstocking Approach
- Stabilizing fluctuating inventory costs with Forecasting by Machine Learning Modelling
Recommendation 1 - Catalogue Reduction
I first delved into the sales data of different product sub-categories, analyzing historical sales trends by implementing EDA to understand inventory dynamics.
According to my EDA, I recommended to take away some of the products within 1 sub-category Sport Equipment.
Because the potential profit from these products fail to cover the item cost and the distribution cost, thus would result in a loss (as shown as -ve in the understocking cost column).
Since the company is not making money from this products anyway.
As the chart is showing only a combination of sport equipments only. It needs further detailed investigations to decide which items to eliminate from the catalogue.
| Sub-category | Mean item price (£) | Mean item cost (£) | Overstocking cost (£) | Understock cost (£) | Δ (£) |
|---|---|---|---|---|---|
| Watches | 163.32 | 96.98 | 102.22 | 61.10 | 41.12 |
| Electronics | 163.09 | 96.32 | 101.56 | 61.53 | 40.03 |
| Eyewear | 65.18 | 41.54 | 46.78 | 18.40 | 28.38 |
| Bags | 46.74 | 24.99 | 30.23 | 16.51 | 13.72 |
| Sports Equipment | 12.29 | 7.46 | 12.70 | -0.41 | 13.11 |
Table 1 – Sub-category, mean item price and cost, overstocking and understocking costs, and highest difference between overstocking and understocking costs. All values are in pounds (GBP).
Recommendation 2 - Strategic Overstocking Approach
2 sub-categories were identified for strategic overestocking.
Maintaining these two sub-categories in inventory incurs minimal costs and could lead to substantial revenue through high-margin sales. Conversely, the rest of the sub-categories,
when overstocked, result in increased costs without the same sales potential, since the financial advantage shifts negatively with unsold stock.
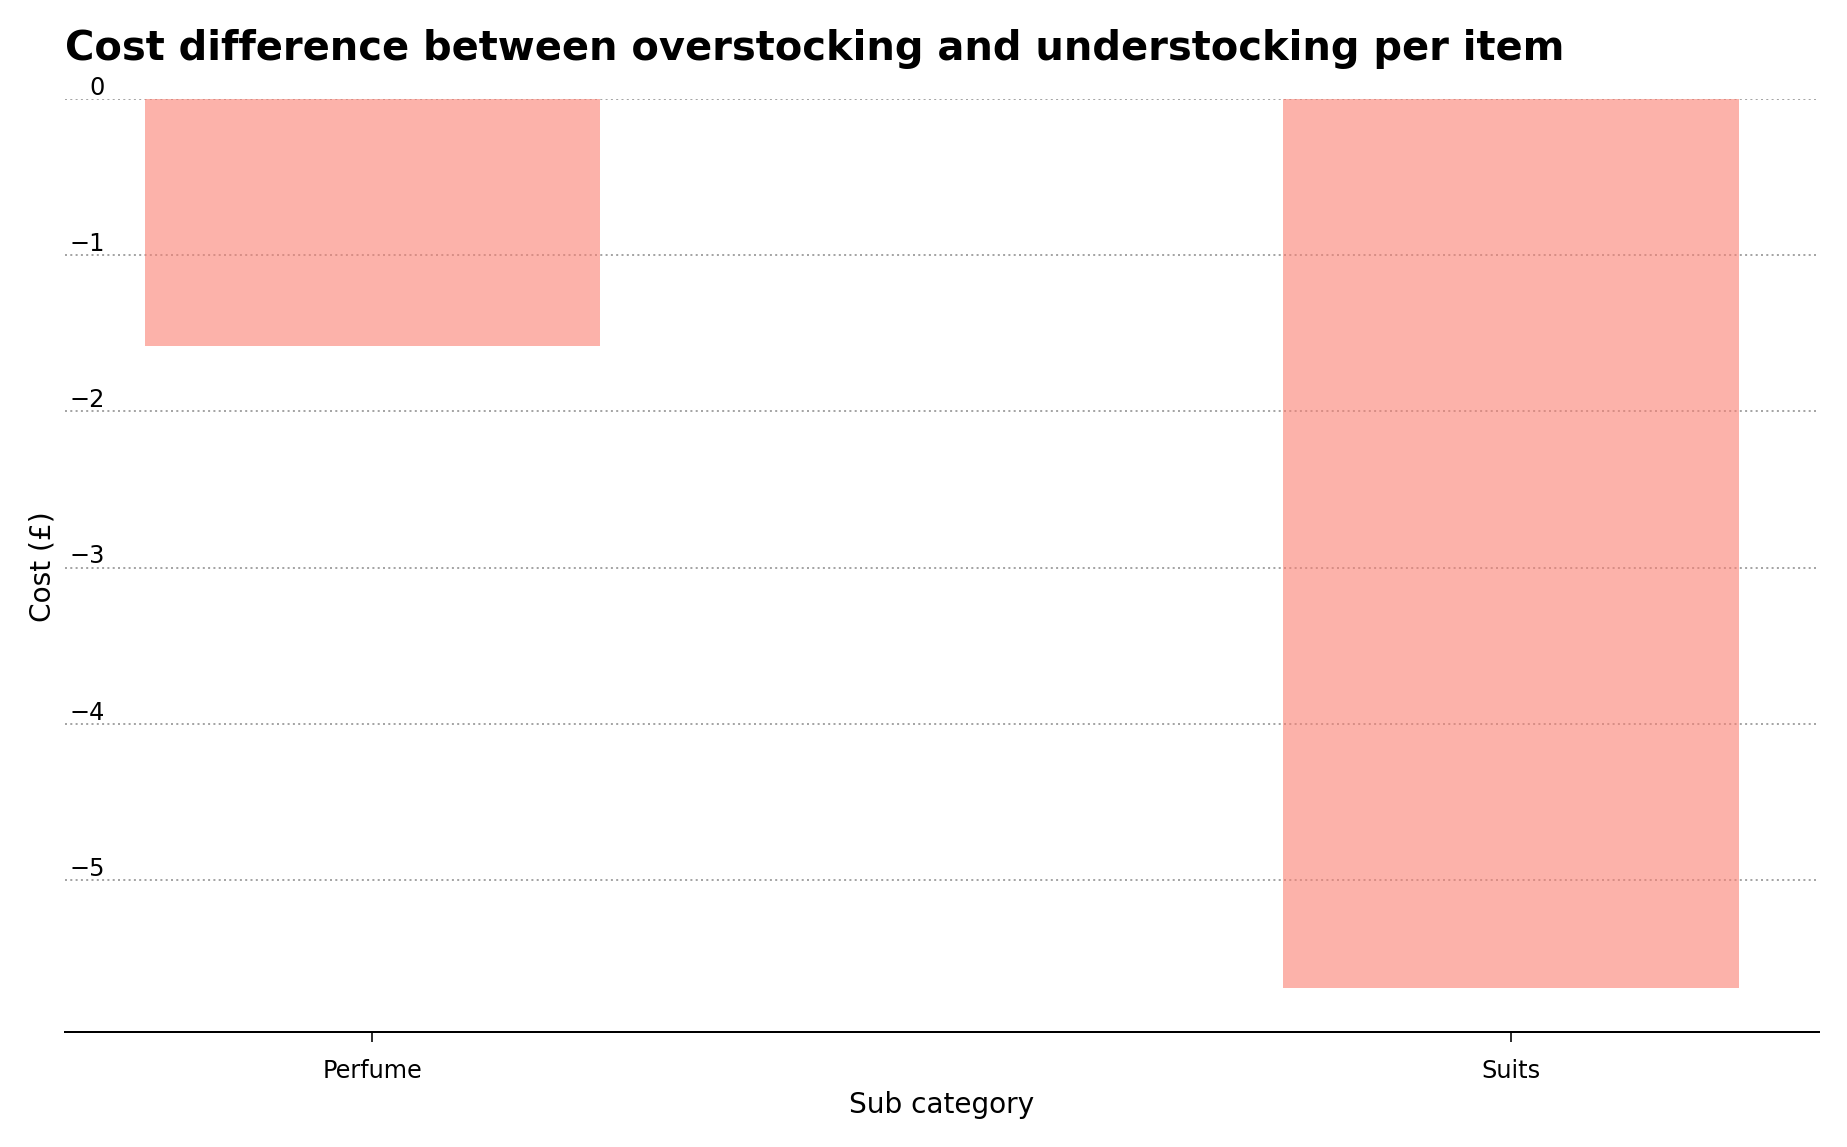
Figure 1 – Negative difference between overstocking and understocking costs for the top two sub-categories.
Recommendation 3 - Machine Learning Modelling
My core analysis revolves using the Facebook Prophet model to forecast future inventory needs. According to the model this suggested approach will save the company 94.6% stocking cost in a year.
I developed a comprehensive sales forecasting model which will forecast 365 days into the future. It was incorporated with the regions festive events, bank holidays, and marketing strategies, and thus has high predictive power.
My recommendation involves stocking within the lower 2.5% confidence level areas which is signified as the arrow area in figure 2.
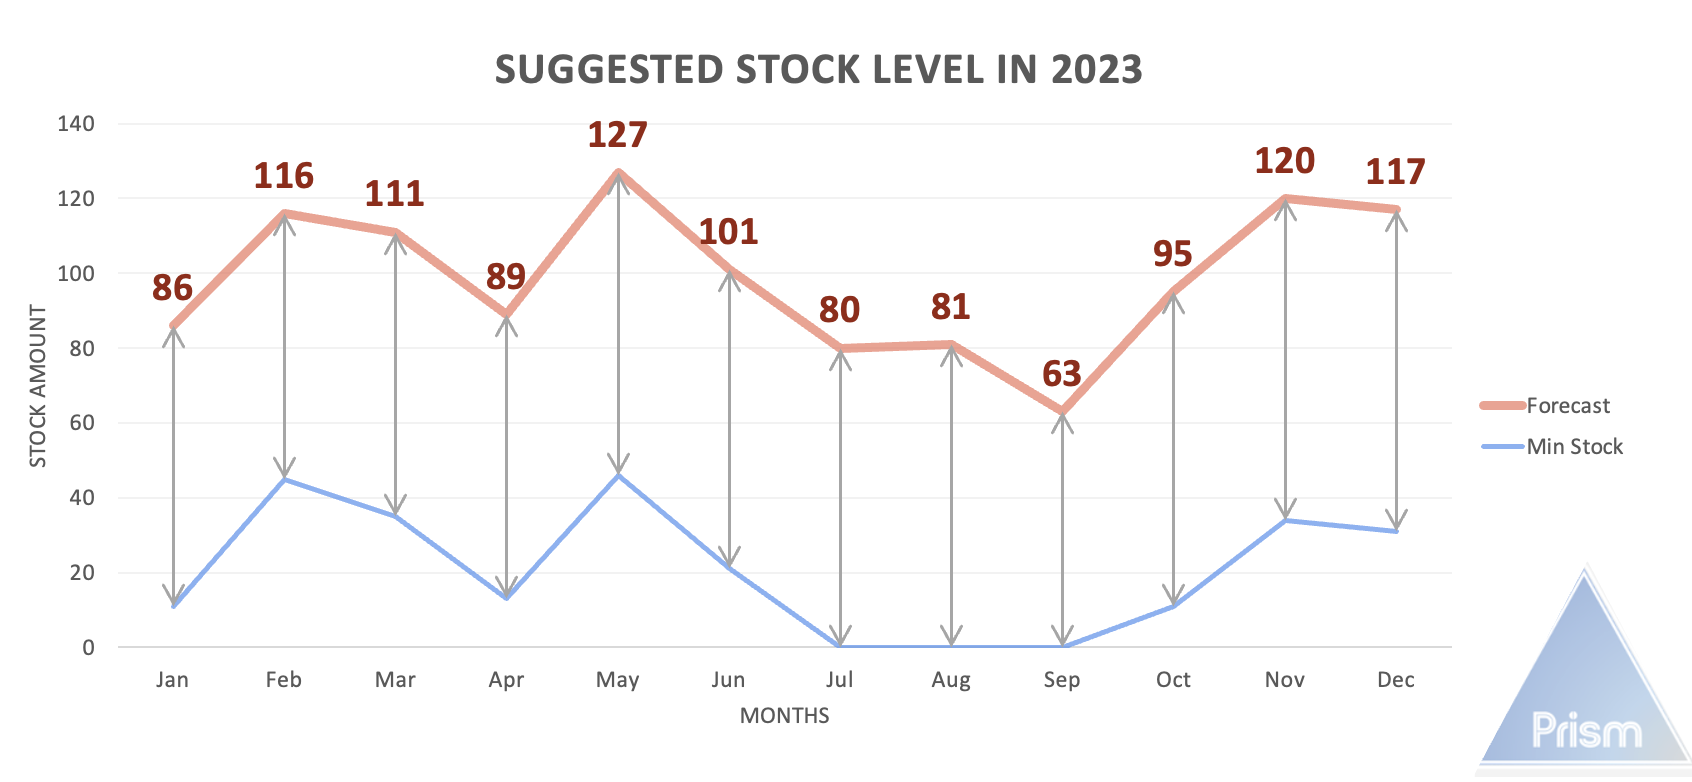
Figure 2 – stocking within the lower 2.5% confidence level area
Back To The Top